Is History Repeating Itself?
Good morning everyone!
The market is up so far this morning as the Citigroup Panic / Euphoria model hits its peak since 2000. The Panic / Euphoria Model is a way of measuring consumer sentiment. On the x axis of the model is time and the sentiment measurement on the y. The market enters a “panic” when we hit -.4 and enters “euphoria” at +.4. The latest reading came in at +1.1 – nearly 3x a euphoric market. The previous high of the model was followed by around a 70% drop in tech stocks. Last week we talked about the number of amateur traders that have entered the stock market using direct to consumer brokerages like Robinhood and the push upwards they have provided for stocks. I came across this graphic which put into perspective really how many traders are entering.
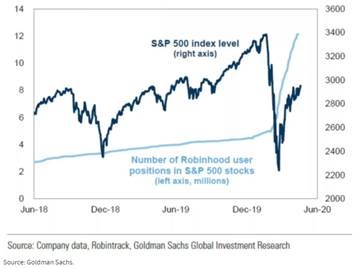
This graph only tracks growth through June. I can only imagine the growth since.
Mortgage backed securities are up this morning after bouncing upward off of their 25 dma late last week. We are holding a locking bias due to the upcoming bond and inflation news early this week.